Financial Benchmarking
Benchmarking – financial information for business management and improvement.


Financial Benchmarking Surveys
- How profitable is your business compared to others in your industry?
- Are you spending too little on advertising or too much on occupancy, wages or other variables relevant to your industry?
- Is your business achieving its potential, what should you be aiming for?
- What are your businesses relative strengths and weaknesses?
- Are your current efforts working or are they misdirected?
Business Performance Comparison Surveys
Business Performance Comparison surveys provide a comprehensive survey of key performance indicators in an industry. This service is typically used by industry groups, associations and franchises as a means of measuring and improving performance within the group.
A Business Performance Comparison survey provides firms with the opportunity to compare their performance with similar firms in their industry or group, including the better performing firms, without individual businesses being identified. The results generated provide valuable information for business improvement, planning and goal setting. A wide range of financial and non-financial measures can be employed to match the industry type and the depth of analysis desired.
What is involved
Setup & implementation
In setting up a Business Performance Comparison (BPC) survey, Artinian Consulting works in consultation with representatives from the group/industry to identify their requirements and the metrics to be reported.
- revenue breakdown by income type
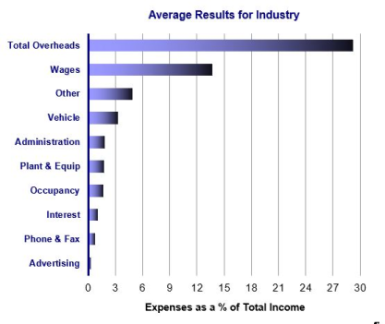
- industry specific breakdown of expenses
- staff salary and wage rates by staff type
- sales/expenses/profit per person (FTE)
- stock-turn and stock levels by product type
- trading days/hours
- business practices/policies/structure
Participant’s Data Inputs: Survey participants provide data from their end of year business accounts, and other in-house sources, to complete the survey questionnaire. Data submitted to the survey are rigorously screened before being included in the final results. Depending on the level of confidentiality agreed to, firms may be contacted during the data validation process if clarification is required.
Online Survey: The survey is run online, with participants accessing the survey questionnaire via their computer web browser. The survey software incorporates data input checks and help guides to assist in the accuracy of data submitted. Access to the survey can be shared and progress saved until completed. The survey software employed utilizes industry standard security measures in all aspects of data transmission and storage.
Survey database: All data submitted to the survey (survey database) is stored on secure servers provided by the survey software provider. Only Artinian Consulting has full access to the survey database for the purposes of analyzing and reporting the survey results.
Reporting
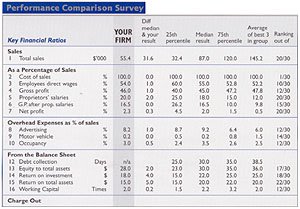
An individualized comparison report is generated for each participant to facilitate comparisons with the range of results returned. Two levels of reporting are utilized: aggregate reports showing the results for the group as a whole and subgroup reports which break the results down into groups based on, for example, total income bands, net profit per working owner, location or product type. Depending on sample size, additional subgroups can be generated.
The results are typically displayed using percentiles to show the spread of results and to enable firms to see where their results are placed. Averages, including the average of the top performing participants’ results for each ratio, are also generated.
Participants download their individualized reports from a secure file sharing platform (login/password protected) once the survey analysis is completed.
Higher level reports can be generated if required to provide management and other stakeholders with the key summary information they need for assessing/monitoring performance. These reports show the results of the group as a whole, with no individual participant’s results revealed.
Survey Administration
We can coordinate the entire survey process, including contacting firms with information on the survey and inviting them to register, providing assistance to complete the survey, and sending participants reminders to meet survey dates. Once the survey is completed, participants are given access to download their individualized reports and any queries regarding interpretation of the results are handled. However, our involvement can be varied depending on the degree of autonomy required or to reduce costs.
Fees: The fee for conducting a BPC will depend on factors including how bespoke (niche) the survey group is, and the number of participants to be surveyed. Contact Artinian Consulting for a more detailed quote for your group.
Confidentiality: All data and participant details are kept strictly confidential. Participants are assigned a code number and all information is analyzed, processed and reported using this identifier. Access to the coding database is restricted. No individual business’ set of results are revealed or can be derived from aggregated group level results.
Clients
We have experience in conducting financial surveys for a wide range of industry groups, associations and franchises, including: Mitre 10, Transporting New Zealand, ValGroup, optometrist franchises, Nursery and Garden Industry NZ (now NZPPI), and other electrical, engineering and retail associations; as well as nationwide surveys on legal and accounting practices.
Further Information
If you would like further information or wish to discuss running a Business Performance Comparison survey for your industry/group, please contact Artinian Consulting.
NZ Business Benchmarking Survey
For over 35 years the benchmarking unit at University of Waikato, gathered financial
This survey was closed in 2018, with the 2017 financial year end results, reported in June 2018, being the last published. The 2017 and previous year reports can be purchased through the University of Waikato, New Zealand Institute for Business Research at NZ Business Benchmarking Survey reports.
Survey background: The data analyzed in the survey were collected from NZ accountants and rigorously screened to generate robust financial information on NZ businesses. The statistics reported were widely recognized by business practitioners, government agencies and industry commentators as the accepted standard for benchmarking SMEs in NZ.
The business classifications reported utilized the ANZSIC structure, along with the survey’s Custom Classes – added to provide more detailed business category reports. Over 430 industry classifications were reported in the 2017 financial year end survey.